What is behind slow pace of play in golf? Here is a look into the structure of a golf course and what mechanisms produce its pace outputs.
Elapsed Time Pace vs Wait Time
Over the last ten years, the industry has armed itself in numerous ways to attack the challenge of slow play. From books like Lou Riccio’s Pace of Play Bible, to the PGA Tour implementing new rules and measurements on pace, to industry technologies like FAIRWAYiQ, the overwhelming attention given to this challenge is a testament to the resiliency of the game.
Over the next series of articles, FAIRWAYiQ will highlight sections of the Pace of Play Bible written by our Chief Analytics Officer, Dr. Lou Riccio. The goal of each article is to highlight the best practices that Golf Professionals should consider when looking to improve the playing experience. Today, we’ll focus on Factory Physics.
Factory Physics
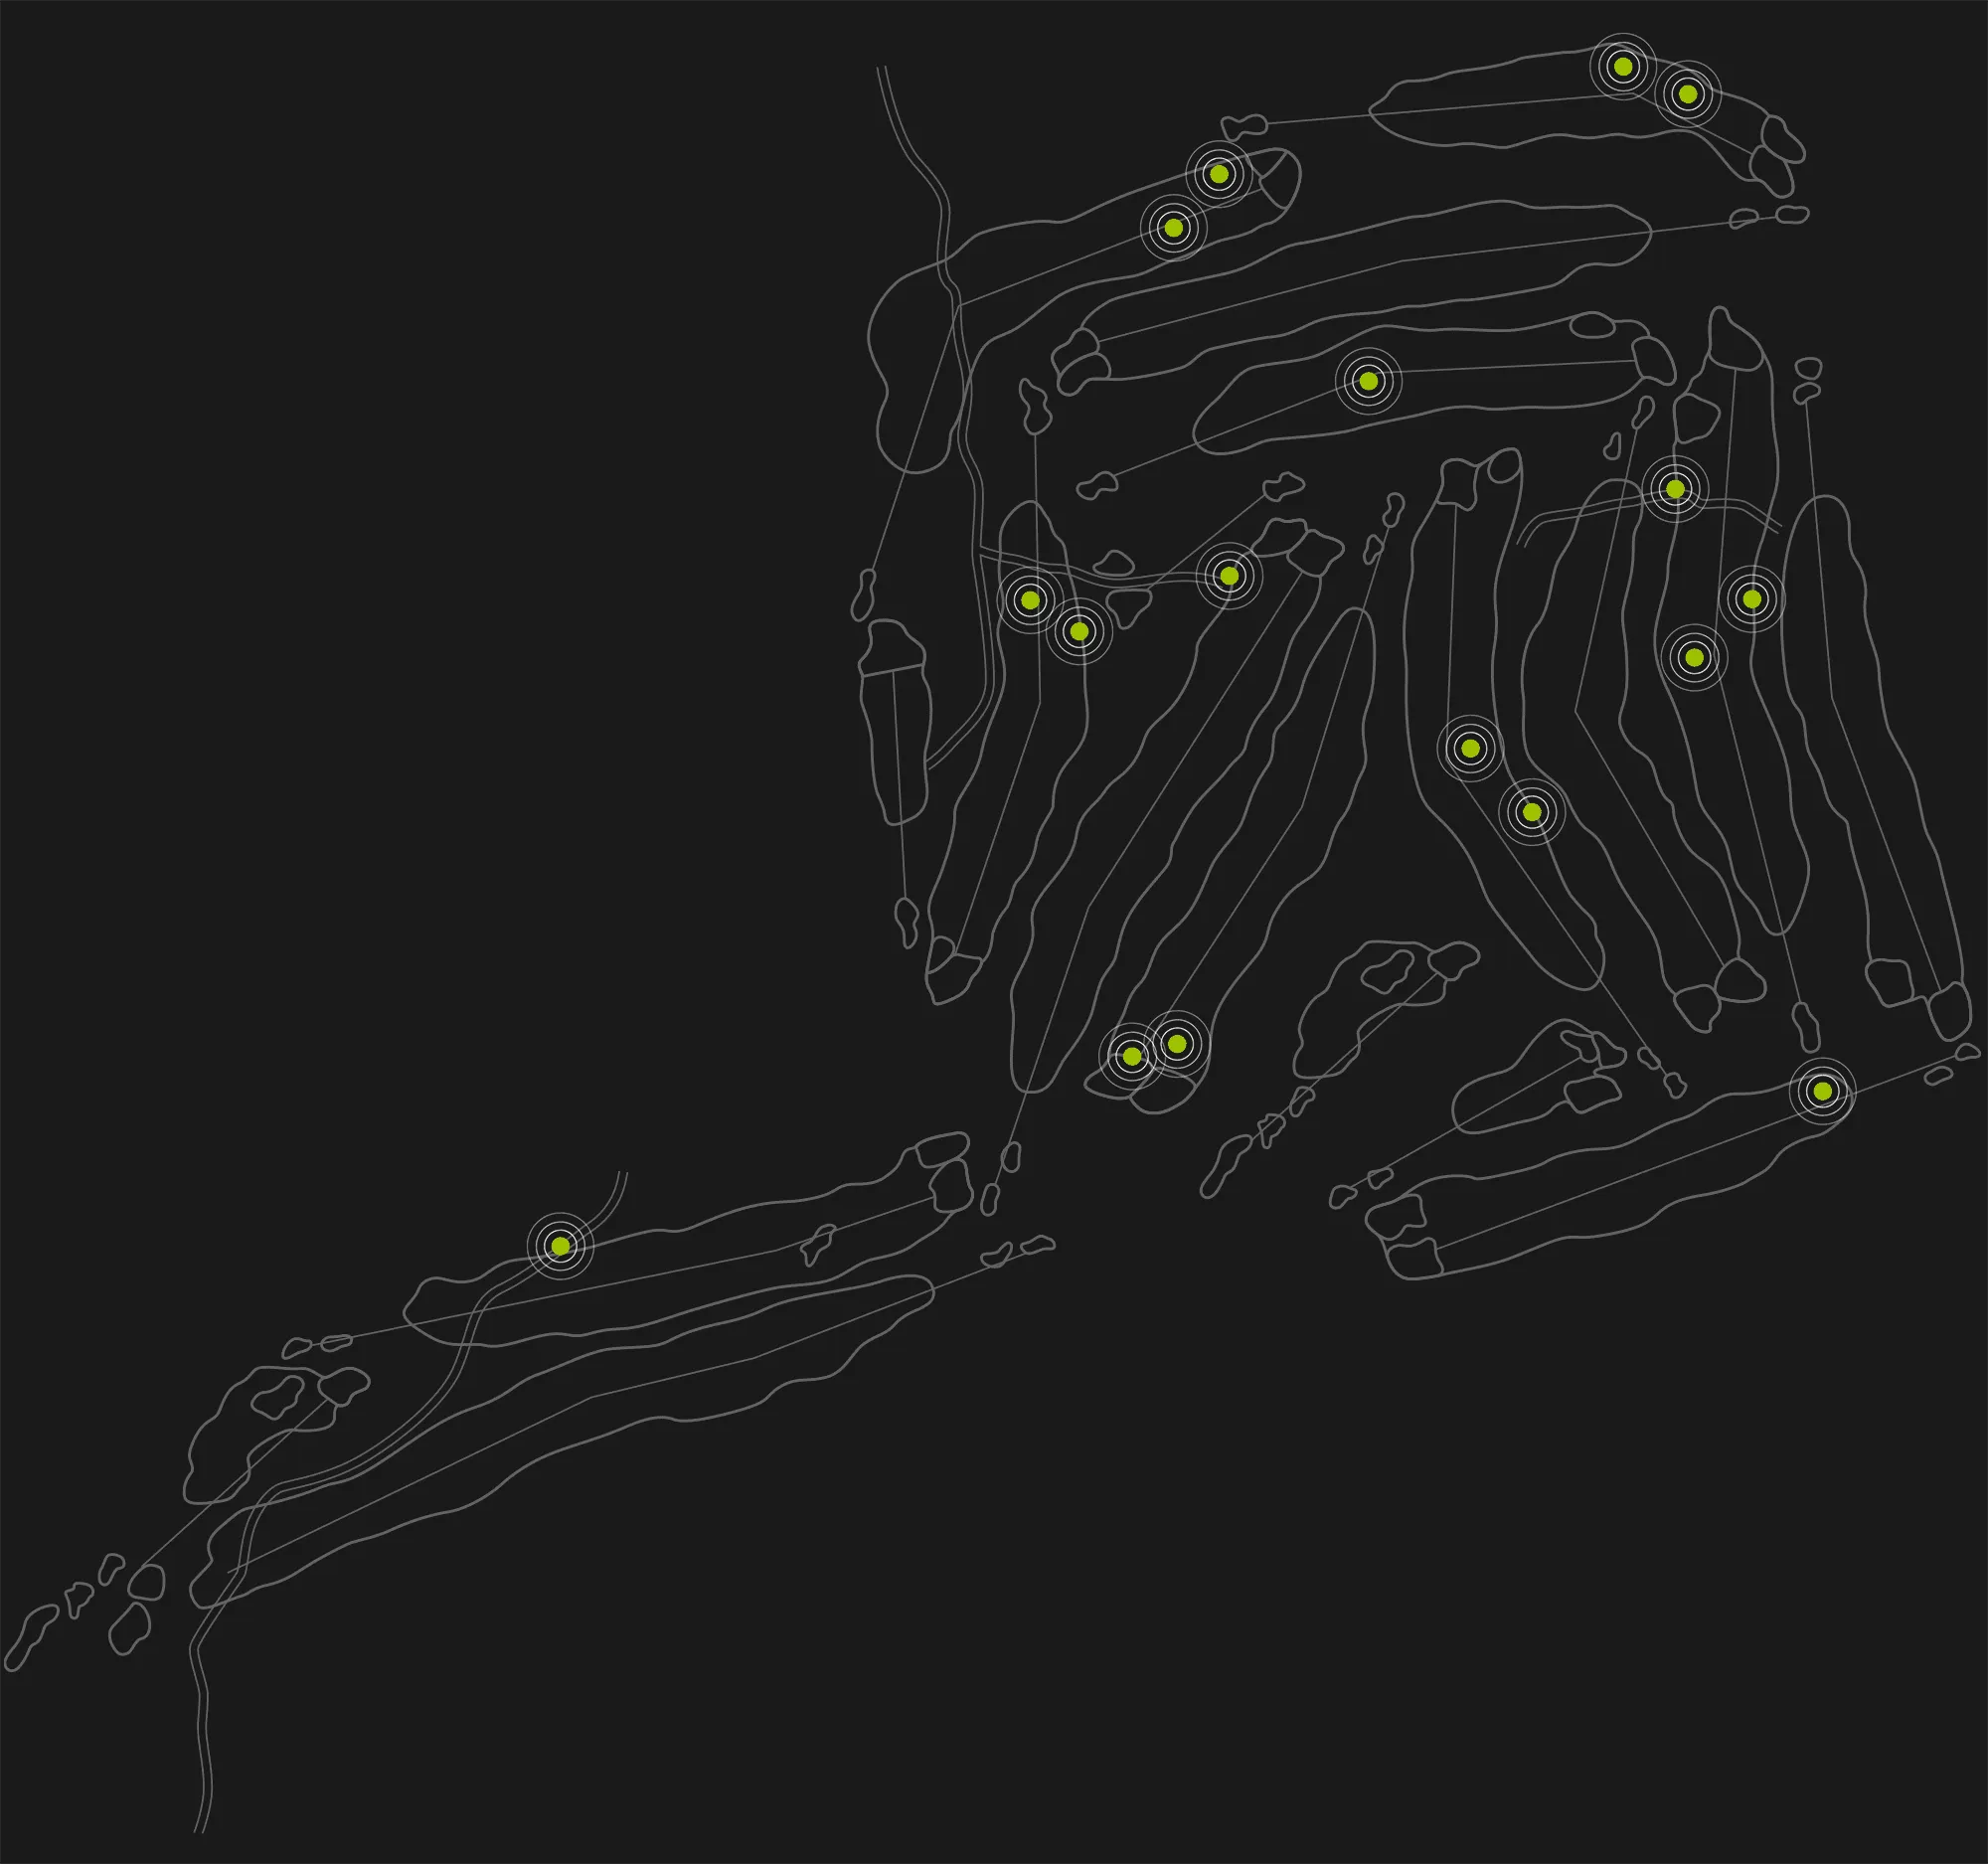
At its core, the golf course is fundamentally a factory that produces rounds played by golfers. Players (widgets) going through holes (processes). Factory Physics provides a different way to look at the golf course and what to consider if we want to improve our efficiencies. Understanding this provides a perspective and approach to solving pace problems that often get overlooked. Traditional golf cart GPS has not done much to improve pace.
The 5 major components of factory physics are: Throughput time, Throughput Rate, Cycle time, Capacity, and Bottleneck.
For working definitions, here is how Lou describes each component:
“In factory physics, the time it takes one unit of product to go through the whole process, from start to finish, to go from raw input to finished product, is called Throughput Time. That would be equivalent to the time it takes one group to play their full round of golf.”
“The amount of product that comes out of the factory per unit time (per hour or per day) is called the Throughput Rate or just Throughput (not to be confused with Throughput Time.) In golf, the number of groups who finish their rounds per hour or per day is the throughput. Throughput determines revenue.”
“Another time measure is the time between successive outputs, or completed products, of a factory. Stated another way, when one unit comes out of a factory, how long will it be until the next finished unit comes out? That is called Cycle Time. In the world of golf, that would be the time between successive groups finishing the 18th hole.”
“The Capacity of a factory is the maximum amount of product it can finish per time period, per hour or per day. Whether the factory is making cars or Oreo cookies or tee shirts, there is a limit to how many it can produce per time unit. All production systems have a limit. How much is the limit? How do you calculate that limit? Good managers are always looking for ways to maximize their capacity, to get the most out of their factory.”
“The capacity of a factory is equal to the capacity of the lowest capacity operation. If a factory has several operations done in series, the one that can produce the least per hour is the one that determines how many units the entire factory can produce per hour. The lowest capacity operation is called the Bottleneck. If a factory had five steps to produce a product, and the operations at four of those steps could produce 10 units per hour and the fifth could produce 8 units per hour, the factory’s capacity would be 8 units per hour.”
Pace and Traffic Problems
All of the components above are critical to understanding pace or traffic problems on the golf course. Courses that are committed to optimizing pace and revenue will benefit from understanding the data to optimize for experience, wait time, or revenue. Lou mentions, “...groups should only be allowed onto the course at the same rate as they come off. The tee time interval is the key to maintaining an optimal number of groups on the course.” The balance of tee time intervals should properly match the bottleneck of the course (typically a par 3 for most courses).
Another way to look at this with numbers is described by Lou here:
“On the other hand, capacity and throughput time are only remotely related, related only by the time it takes to get through the bottleneck. For example in the five-operation factory discussed above, the capacity of the factory is equal to the capacity of the bottleneck, 8 units per hour. The other four operations have a capacity of 10 units per hour. The throughput time of this process is the sum of the times to complete all five operations. The time to get through the bottleneck operation (assuming no waiting time) would be 7.5 minutes, found by dividing 60 by 8 per hour. The time to get through each of the other four is 6 minutes found by dividing 60 by 10 per hour. Thus the total throughput time is 31.5 minutes.
If we now improved the capacity of one of the nonbottleneck operations to 12 per hour, the time to finish that operation would now be 5 minutes and overall throughput time would be improved. However, the factory can still only produce 8 per hour or one every 7.5 minutes, since the bottleneck has not changed. In that case, throughput time is improved but cycle time (and by definition throughput rate) is not changed. One lesson from this is changes may lead to the improvement in one measure of system performance but not others. In some cases, it may lead to an improvement in one and a reduction in another. Understanding how all aspects work together, not just one or two, is critical to improving system performance.”
Cycle Time for Bottleneck Holes is Next
The cycle time for a hole that is considered the bottleneck is where the attention should be placed.
In our next article, we will dive into the cycle time.
Related Posts

Precision GPS for Golf Carts: Lessons from Agriculture

Golf Cart Geofencing
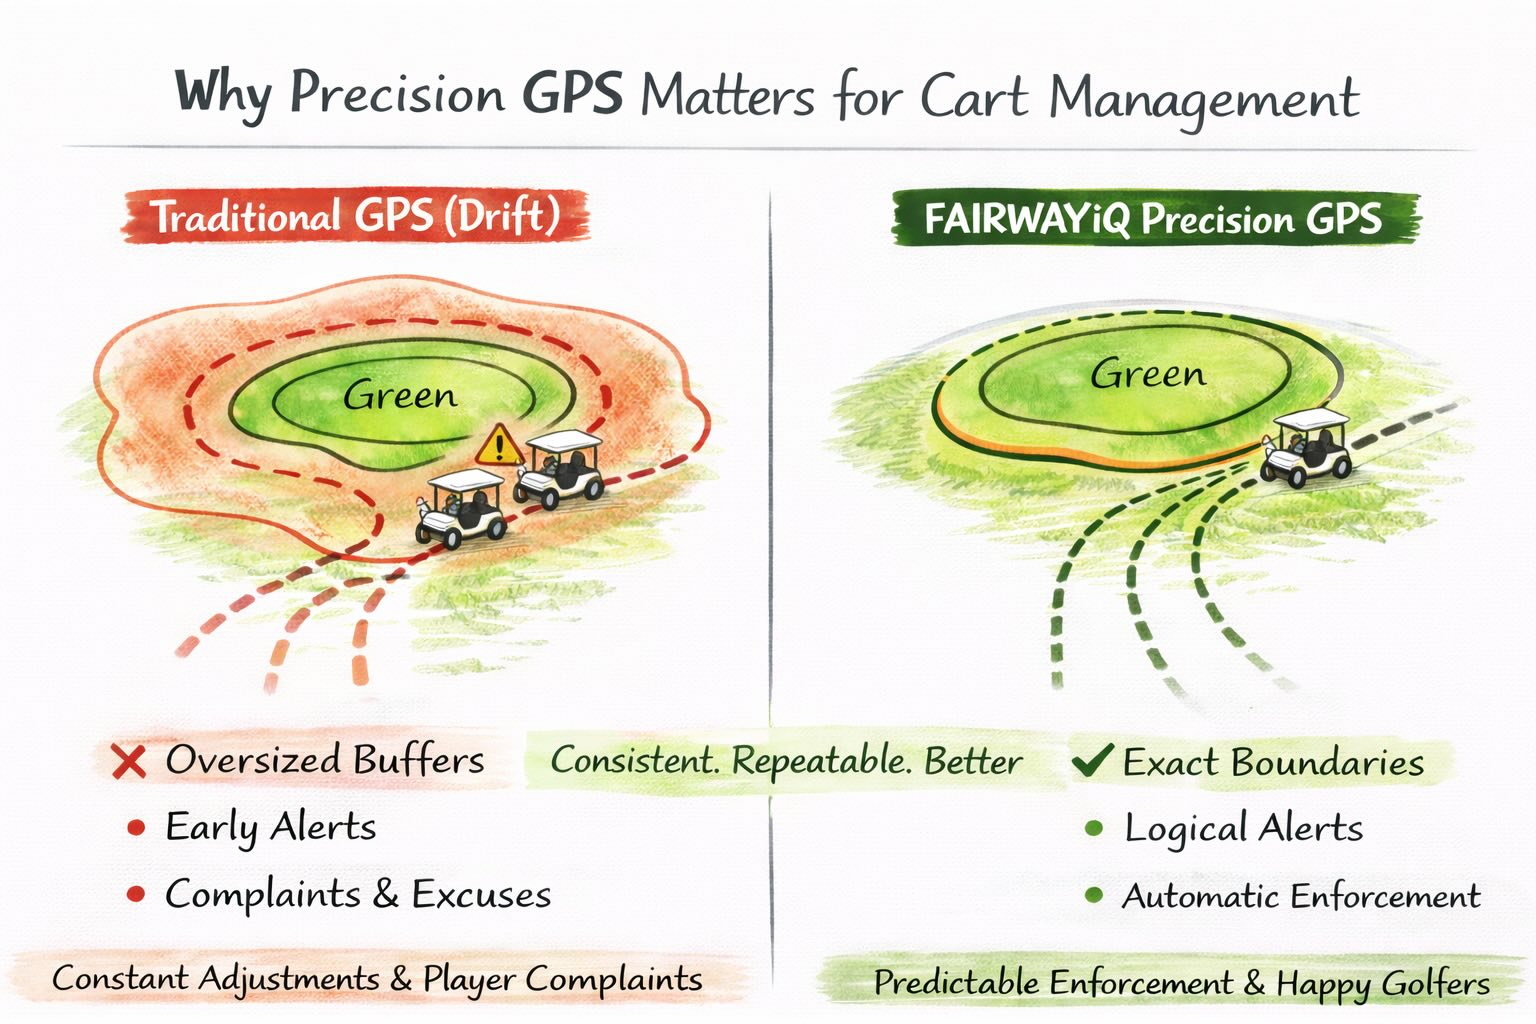
Precision GPS for Golf Carts
Revolutionize Your Golf Operations with FAIRWAYiQ
Unlock the power of data analytics to optimize your golf course management